Financial Benchmark Sensitivity
Beta, alpha, correlation and tracking error against a total-trade benchmark, with asset-style tags.
Orion is one workspace: pick a commodity and corridor, run a report, and get back asset-grade analytics with a plain-language read — refreshed nightly on global trade data.
Score any flow against a total-trade benchmark. Orion computes beta, alpha, correlation and tracking error, then labels whether the commodity amplifies or dampens the trade cycle.
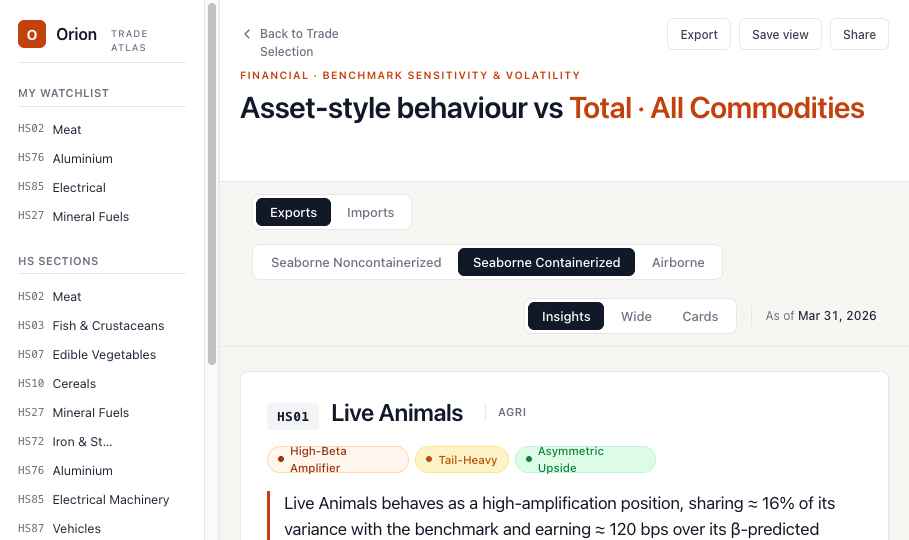
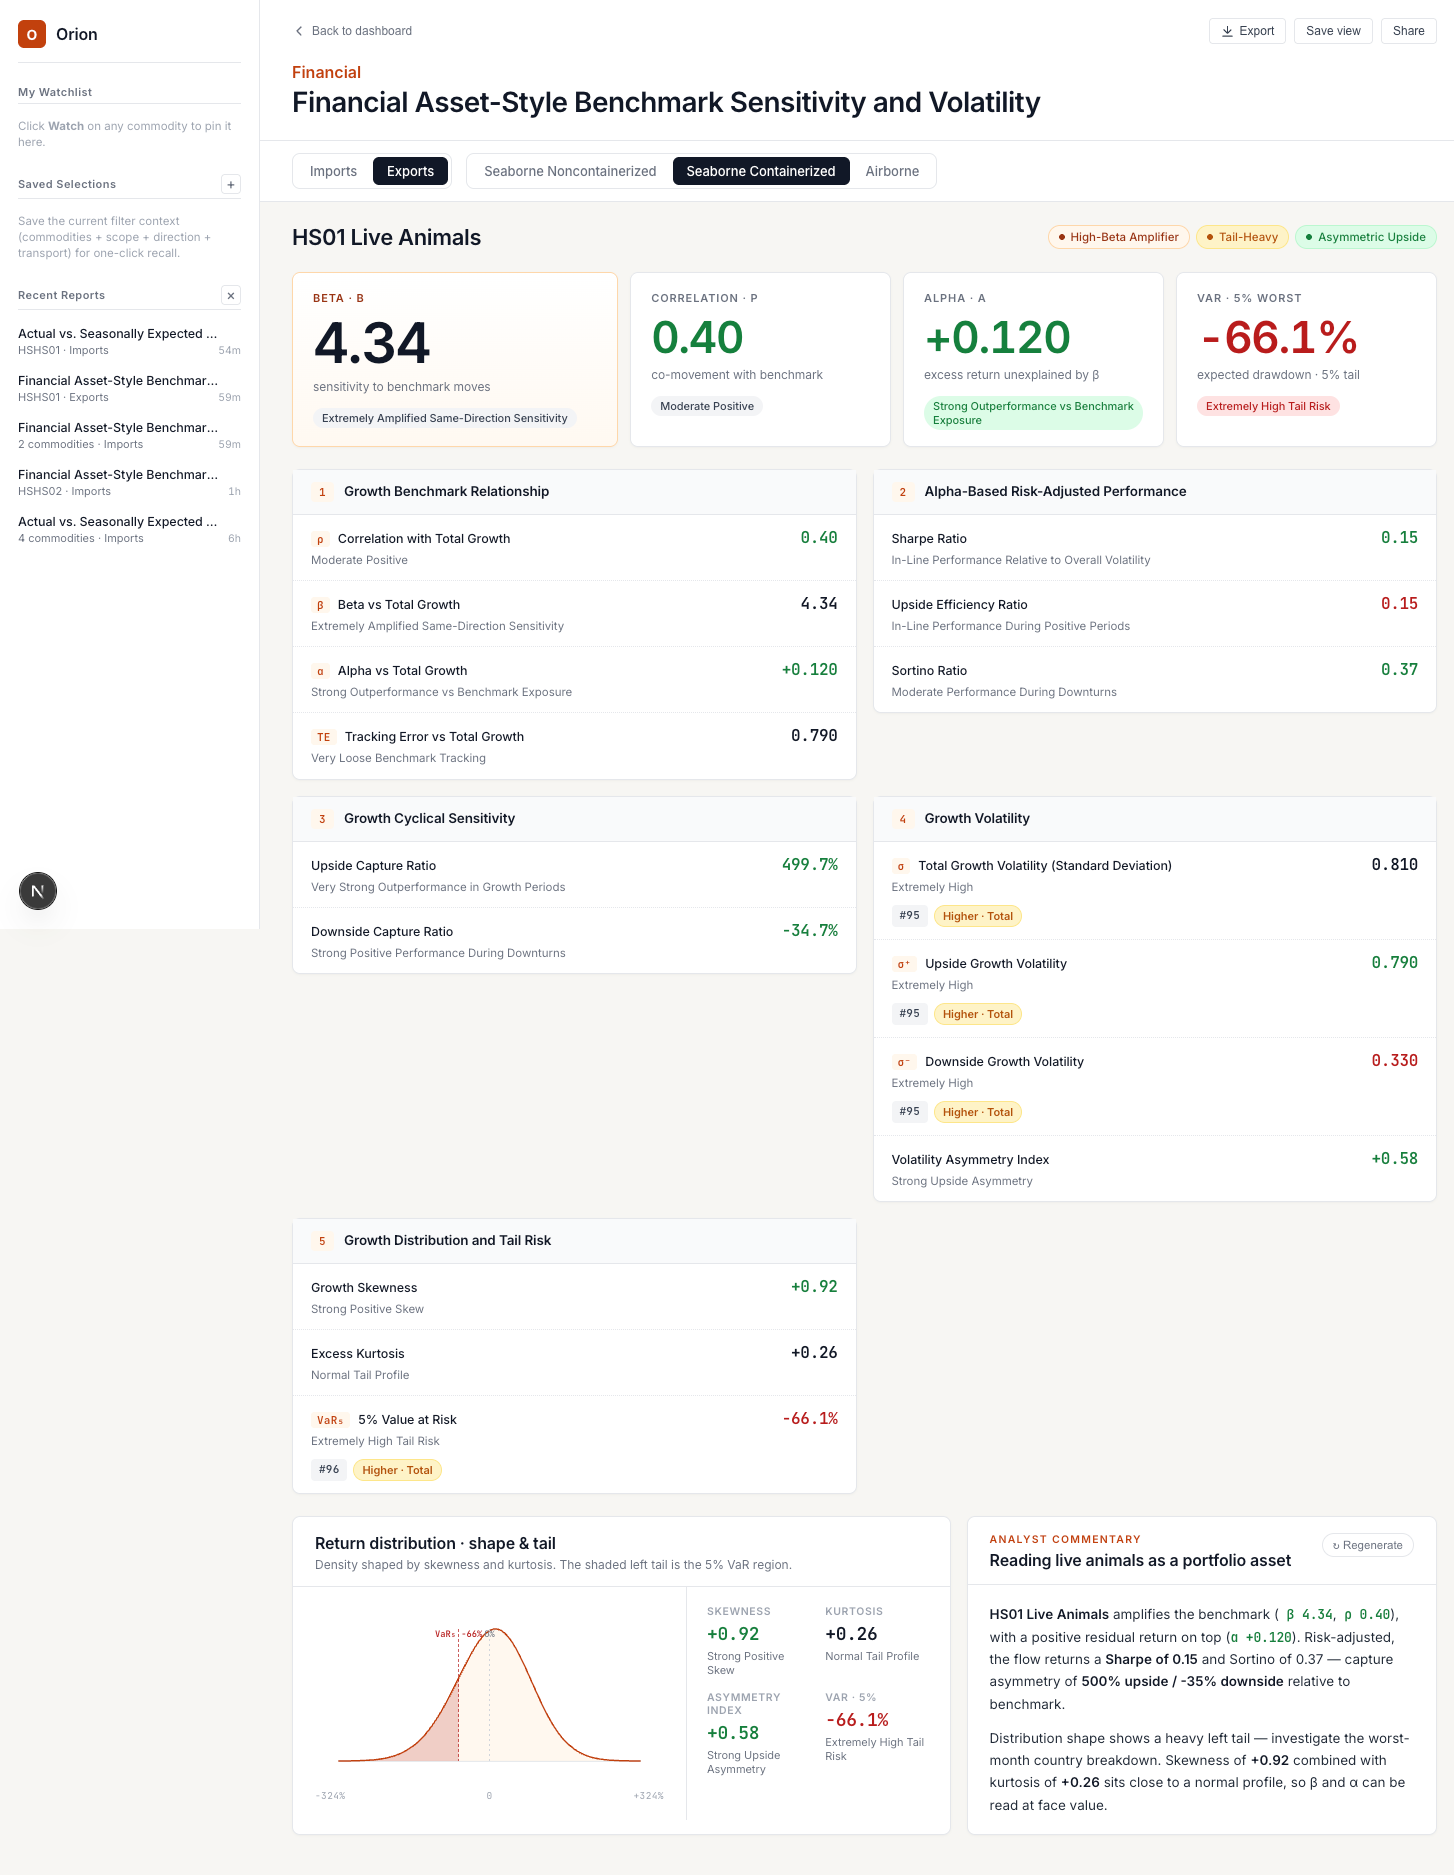
Separate good volatility from bad. Orion splits dispersion into upside and downside, reads skewness and kurtosis, and shades the 5% VaR tail on the return distribution.
Switch any report into tariff mode, select partners, and layer a regime onto the corridor. See the delta on landed cost and exposure side by side with the base case.
Start from a report type, not a blank canvas. Each one carries its own layout, metrics and written read.
Beta, alpha, correlation and tracking error against a total-trade benchmark, with asset-style tags.
Upside/downside dispersion, capture ratios, skew, kurtosis and the shaded 5% VaR distribution.
Roll up performance across commodities and corridors into one comparable scorecard.
Compare realized flow against its seasonal baseline to spot genuine surprises.
Layer a tariff regime onto selected partners and read the landed-cost and exposure delta.
Recall a full filter context — commodity, scope, direction, transport — in a single click.
Tell us the flows you track. We'll build a live sample report and walk you through the read.